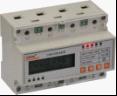
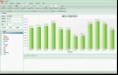
Xu Shuang Ankerui Electric Co., Ltd., Shanghai Jiading 201801 0 Project Overview A cement plant in Shandong has two clinker production lines with a daily output of 5,000 tons and a cement grinding station with an annual output of 1 million tons. In order to develop a recycling economy, the plant has built 6MW and 9MW pure low temperature waste heat power generation stations for two clinker lines . Cement companies are typical industries with high energy consumption. The coal, electricity and water costs of the plant account for more than 70% of the total production cost . Therefore, establishing an effective energy management system and saving energy and reducing consumption are urgent requirements for the company's healthy development. Accor Electric Co., Ltd. undertook this project in April 2010. The entire system uses Acrel-5000 energy monitoring system to achieve on-line monitoring and energy consumption management of the company's electricity consumption and water consumption. 1 target mission Monitor, analyze and control energy use, accurately record the energy consumption of each link and equipment of the cement clinker production line, record and analyze and evaluate the overall energy consumption and cost levels, thereby reducing the overall cost of energy consumption for each link and line energy, and at the same time, the energy data Sublimation is valuable information for the mastery and analysis of energy use in various parts. Energy costs are allocated to each workshop, team, equipment, production link or line and are linked to performance assessment. Automatically generate energy consumption statistics for each class A , B , C , and D , and the number of shutdowns and operation time of major equipment. Energy consumption is represented by curves, bar graphs, etc. to facilitate the collection of energy data and analysis of equipment status. Further discover the links of energy use leakage and energy-saving space, and evaluate the actual effects of various energy-saving measures and equipment. 2 overall design The energy management system utilizes modern network technology and computer technology to monitor various operating energy parameters in real time and continuously transmits them to the system server. This enables the operation management personnel to fully understand the operating conditions of the system through the monitoring center and to easily perform various data analysis. Through this system, it is possible to accurately record the energy consumption of each workshop and major equipment, record and analyze the decomposition of the overall energy cost level and energy costs, find excessive consumption points of energy consumption, monitor energy consumption information in real time, and mobilize the Enthusiasm to help improve the efficiency of energy-saving emission reduction. 2.1 system composition The system consists of field monitoring equipment (including a variety of smart meters), communications equipment (industrial computer data Ring), Energy Management System Software 3 parts. A sensing instrument mainly uses Schneider's products, and data acquisition devices, data processing servers, network servers, network communication facilities, hosts, and terminal displays all use domestic advanced products. 2.2 System Structure The data acquisition of this system is all from the on-site smart meters and is completely isolated from the industrial control network, ensuring the safe, reliable and stable operation of the industrial control network. The system is interconnected with the ground management data network to realize WEB information transmission and distribution. The system is based on the TCP/IP architecture and has interoperability interfaces with other subsystems. The internal energy monitoring and management system of the system adopts a hierarchical distributed structure to facilitate the management and maintenance of users. The system uses dedicated energy monitoring and management software. 2.3 System Principle Through this system, energy consumption data of energy consumption monitoring points are acquired in real time, energy supply, distribution and consumption are monitored, energy consumption status is grasped in real time, energy consumption structure is understood, energy consumption standards of various equipments are calculated and analyzed, and energy of various operation links is monitored. Abnormal consumption situation, assess the impact of various energy-saving equipment and measures, and publish various energy consumption daily report forms and various energy consumption data curves to relevant management and operation personnel through WEB to share the achievements brought by energy informationization. Completed the monitoring of the energy system of the enterprise and the monitoring and management of the state of energy consumption of the electricity load. Provide data support for energy-saving projects. 2.4 System Functions 1 ) Real-time monitoring of energy data. Accurate energy consumption data is the basis for energy conservation. The energy management system can perform real-time monitoring of energy consumption information for cement clinker production processes, including limestone crushing, raw material grinding, pulverized coal preparation, clinker burning, and waste heat power generation. The monitored data includes electrical energy data, steam data, coal consumption data, compressed air data, water consumption, and raw material consumption. 2 ) Form important energy consumption reports. Regularly provide comprehensive energy consumption information such as electricity consumption, coal consumption, water consumption, gas consumption, etc., for unit clinker, and calculate the unit consumption and total consumption for each production process. The report is divided into daily, monthly, quarterly and annual reports. Analysis of electricity, coal, water, compressed air, steam consumption, as well as host equipment operation time, number of shutdowns and other information. The system can also analyze and compare the energy consumption between different types of equipment of the same type and different types at different times, and provide data reference for discovering the leakage point of energy saving. 3 ) Analyze the energy consumption load characteristics. A series of load comparison analysis is carried out by means of charts, bar graphs, curves, etc., including unit energy consumption comparison, important load comparison, first- and second-line comparison of similar load energy use, etc.; the system will store the analysis results in the database for a long time, taking into account Information on energy consumption, production planning, and output, and summing up experience, make the equipment operate in an economical and reasonable manner, and achieve energy conservation and consumption reduction of the system. 4 ) Detailed cost management. Scientifically define and analyze the energy cost of each department and team. It can achieve statistical analysis of energy consumption data of every class under the “ four shifts and three operations †model of each workshop and clinker line A , B , C and D , and can achieve The analysis of class and day makes the analysis of energy consumption more accurate, timely and detailed, and improves the control of energy cost. By comparing the energy consumption data of various departments and teams, we can find bad operating habits and form scientific management and assessment methods. 5 ) Early warning and diagnosis of abnormal energy consumption. The automatic diagnosis and alarm prompts are made for the energy consumption abnormalities of the energy-consuming equipment and measurement points that do not conform to the process flow. Alarms for energy-consuming equipment that exceeds the power range, and diagnostic information for matching conditions of important equipment operations. The central control room management personnel can promptly make scientific treatment according to the system prompts to effectively prevent leakage and provide reliable protection for the safe and stable operation of the production line. 2.5 Software Features PC software is Acrel-5000 energy monitoring system configuration software, which is dedicated software for collecting and monitoring on-site energy consumption data. The biggest feature is that it can be used in a flexible and diverse "configuration" rather than programming System integration, it provides a good user development interface and a simple method of engineering implementation, as long as its pre-configured various software modules for a simple "configuration", it can be very easy to achieve and complete the collection of on-site data With monitoring capabilities. Acrel-5000 energy consumption monitoring system has a friendly human-computer interaction interface, which can collect the parameters of the field device and switch status in real time and at regular intervals, and upload the collected data to the data center for storage. The system also provides analysis of real-time curves and historical trend curves, and meets the functions of reports, event records, and fault alarms required by users' designs. The entire system can realize the collection and statistics of all loop energy consumption, and realize remote automatic meter reading and energy consumption monitoring. 1) Operating status monitoring: Communication abnormal alarm. 2) User management: Different user rights have different operation functions, password modification operation functions for each level of authority, and the authority to prevent mistakes. 3) Energy consumption reports and bar graphs: Time-based query of all energy consumption reports is divided into daily, monthly and annual reports, and any energy consumption bar graphs with real-time energy consumption can be displayed. 4) Print and Export: All reports and interfaces can be printed or exported in EXCEL and WORD formats. 3 Network Implementation Solution The system monitoring center is located in the central control room and serves as the data and management center of the energy management system. It assumes the functions of data acquisition, storage, statistics, and analysis of the entire energy management system. It also manages the user rights and Web publishing functions of the entire system . The entire system uses optical fiber, Ethernet bus, RS485 and other transmission media to form an independent, dedicated communications network. The trunk line adopts industrial-grade optical fiber ring Ethernet, and the ring backbone network sets a total of 11 network nodes, including the monitoring center, the main step-down station, the electrical room of the waste heat power plant, the first-line kiln electrical room, the first-line raw material grinding electrical room, and the first line. Raw material processing electrical room, second-line kiln head electrical room, second-line raw material grinding electrical room, second-line raw material processing electrical room, limestone crushing electrical room, pulverized coal preparation electrical room, other electrical room, work room, etc. Signal adopts optical fiber, RS485 or signal The cable is connected to the nearest One of these 10 nodes realizes data transmission with the monitoring center. The energy management system adopts a hierarchical distributed network structure (Figure 1 ). The system is divided into three layers from the bottom up : the on-site monitoring layer, the communication layer, and the system management layer. Figure 1 Network structure of an energy management system in a cement plant 3.1 On-site monitoring layer The on-site monitoring layer refers to the on-site monitoring equipment that directly collects on-site equipment data and has an upload function, including a flow meter, a power parameter measuring instrument, a pressure sensor, an electronic scale, and a programmable controller PLC . These monitoring devices complete signal acquisition and processing, and are converted into communication signals to access the network communication layer. The on-site monitoring layer of the Donghua Cement Energy Management System will monitor the field data of 8 subsystems: electrical energy subsystem, water use subsystem, coal supply subsystem, diesel subsystem, compressed air subsystem, steam subsystem, raw material subsystem, and smoke Gas subsystem. 3.2 Network Communication Layer The network communication layer refers to the generic term for the underlying communication links (such as RS485 ), communication conversion equipment (Ethernet gateway), and top-level communication links (such as fiber optic Ethernet, TCP/IP network) involved in the completion of energy management system communications . This part is the link linking the on-site monitoring layer and system management. The project site communication network adopts RS485 bus mode and supports Modbus communication protocol. Switch to Ethernet via Ethernet. Ethernet Off Extended RS485 Serial Interface, Supports Modbus Fieldbus Protocol, Each  Up to 32 smart devices can be connected to the RS-422/485 channel . Through the Ethernet switch, the low-speed serial signal is converted to high-speed Ethernet, and the field-level power data is transferred to the local area network to facilitate the management of the upper system. Industrial-grade optical switches convert Ethernet electrical signals into optical signals, and multiple Ethernet switches form a fiber ring network. Depending on the good anti-interference and transmission performance of optical fiber networks, it can better adapt to harsh electrical environments and remote data transmission. A full-duplex switched optical fiber ring network structure is adopted between the monitoring center and each site (optical fiber communication node). Optical fiber self-healing ring technology has the characteristics of good stability, high reliability and strong self-healing ability. Failure of the line at any point in the fiber ring network will not cause communication failure. 3.3 System Management System management is the top management of the energy management system. The entire system management equipment is located in the central control room. Configure a monitoring server, an operating workstation, a WEB server, communications equipment, laser printers, UPS, etc. The data server uses high-performance computers, and the energy management software uses professional monitoring configuration software. This layer completes the real-time data uploaded by the on- site monitoring layer and the DCS system, and analyzes, converts, and stores these data and displays them on the screen in the form of figures, curves, and reports. The energy management system must adopt a hierarchical distributed network structure and should have good reliability and real-time performance. The monitoring software should be based on the Windows 2000/2003/XP Chinese operating system, using the client / server model of the distributed network structure, standardized, networked, and functionally distributed architecture; having software and hardware expansion capabilities; supporting system architecture expansion And feature upgrades. At the same time, this layer can provide standard network interfaces and communication protocols to realize the connection with other systems; the system management layer exchanges data with other integrated systems through the OPC Server . It has networking with Shandong Yankuang Group's internal computer network, information management system ( MIS ), production management system (such as: DCS ), building integrated management system ( BMS ), and other interfaces can adopt OPC Server/Client mode. 4 Major monitoring and metering Application model The main function High voltage critical circuit or low voltage inlet cabinet APMD520 Three-phase I, U, kW, kVar, kVA, kWh, kVarh, Hz, cosΦ; four-quadrant electric energy metering, fundamental-wave active energy metering, harmonic active energy metering, multi-rate energy statistics, maximum demand statistics, event recording One-way zero-sequence current measurement, one-way temperature measurement; RS485/Modbus, large-screen LCD display; 3DI/2DO, two analog, Profibus-DP protocol optional Low voltage inlet cabinet ACR330ELH LCD display, all-electric parameter measurement (U, I, P, Q, PF, F, S); four-quadrant electric energy metering, multi-rate electric energy statistics; THDu, THDi, 2-31 times of each harmonic wave component; voltage peak Factor, telephone waveform factor, current K factor, calculation of voltage and current imbalance; positive, negative, zero sequence component (including negative sequence current) measurement of power grid voltage current; 4DI+3DO (DO3 overvoltage, undervoltage, overcurrent , unbalance alarm); RS485 communication interface, Modbus protocol or DL/T645 protocol Low-voltage connection cabinets and outlet cabinets ACR220EL LCD display, all-electric parameter measurement (U, I, P, Q, PF, F); four-quadrant energy metering, multi-rate energy statistics, maximum demand statistics; 4DI+2DO; RS485 communication interface, Modbus protocol Power cabinet ACR120EL LCD display, all-electric parameter measurement (U, I, P, Q, PF, F); four-quadrant energy metering, multi-rate energy statistics, maximum demand statistics; 4DI+2DO; RS485 communication interface, Modbus protocol DTSD1352 LCD display, all-electric parameter measurement (U, I, P, Q, PF, F, S); four-quadrant energy metering, multi-rate energy statistics, maximum demand statistics; current specification 1.5(6)A, 5 (20 ) A, 10 (40) A, 20 (80) A optional, RS485 communication interface, Modbus protocol or DL/T 645 protocol optional Lighting box DTSF1352 Current specification 1.5(6)A, Optional 5(20)A, 10(40)A, 20(80)A, multi-rate energy statistics, energy pulse output, RS485 communication interface, Modbus protocol or DL/T 645 protocol optional Three-phase energy metering DDSF1352 Current, voltage measurement; single-phase energy metering DDSD1352 Current specification 10 (60) A, programmable, multi-rate energy statistics, energy pulse output, RS485 communication interface, Modbus protocol or DL/T645 protocol optional All-electric parameter measurement (I, U, P, Q, S, PF, F) Single-phase energy metering DDSY1352 Current specification 10(60)A, single-phase energy metering, energy pulse output, multi-electrical parameter measurement, contact logic encryption card, RS485 communication interface, Modbus-RTU protocol, LCD liquid crystal display, matching logic encryption card and power system Card prepaid meter Water supply pipe According to the relevant manufacturer model The total amount of water used to measure the water flowing through the water supply pipe is suitable for one-way flow. Electronic direct reading technology is used to output the dial data directly via the RS485 bus without external power supply. Gas pipeline According to the relevant manufacturer model Measuring the total volume of gas flowing through the gas pipeline, with a valve control function, using electronic direct reading technology, through the RS485 bus directly output the dial data, high measurement accuracy, no external power supply. Centralized cooling and heating According to the relevant manufacturer model Measure and display the user's heating supply, the central air conditioning's cooling capacity, and the flow sensor, microprocessor and paired temperature sensor. The temperature sensor is automatically alarmed when the circuit breaker is open or short circuited, and the alarm is automatically triggered when the voltage is low or the attack is destroyed. Through the RS485 bus directly output the dial data, high measurement accuracy. system integration Acrel-5000 Building Energy Analysis Management System On-line monitoring and dynamic analysis of key building energy consumption; Calculate the building's total energy consumption, total electricity consumption, classified energy consumption, sub-item power consumption, electricity consumption per unit of building area, and electricity consumption per unit of air-conditioned area, etc., and convert and calculate the amount of standard coal in the form of statistics and display. Classifying building energy consumption, itemized statistics, and large number of audits Visually reflect and compare the values, trends, and distributions of collected data and statistical data   5 Application effect Acrel-5000 Energy Management System  Since its trial operation in April 2010 , it has achieved initial results in energy consumption management and control by improving, applying, and improving. 1 ) Enhanced benchmarking management. Vigorously carried out the benchmarking activities between classes and between classes, the first clinker line and the second clinker line, and achieved the benchmarking on the day. By looking for energy use loopholes, the failure of important energy-consuming equipment is reduced, equipment operation rate is improved, system downtime is reduced, and energy consumption is reduced. 2 ) Reduced power consumption. Through the energy system alarm, when the total load of the power supply system exceeds the application demand, the system can automatically prompt the DCS operator to adjust the load and shut down the relevant equipment. When the large-scale electrical equipments such as the raw material grinding main motor and the coal grinding main motor stop, the system will automatically prompt the operator to shut down the associated raw material grinding fan and coal grinding exhaust fan in time, which saves power consumption. During the trial operation, three times the wind turbine was stopped and the phenomenon was not timely, reducing the power consumption by more than 5000 kWh . The irrational power usage of Fenggu Power Equipment was adjusted twice. 3 ) Strengthened water management. Once the total pipeline water flow is found to be greater than the sum of its branch flow, or if the branch pipeline flow suddenly increases beyond the normal range, the system will automatically alarm, and the monitoring personnel can conclude that there is a leak in the pipeline, organize personnel to find and handle, and block. Loopholes. During the trial operation, 2 water leakage accidents were avoided . Significant results have been achieved by conducting benchmarking activities and strengthening assessments. references: [1] System Solution Electric Co. Acrel .201 version 2.12. About the Author: Xu Shuang, female, undergraduate, Ankerui Electric Co., Ltd., the main research direction for intelligent power monitoring and power management system, Email: Mobile QQ "Atlas of Design and Application of Building Energy Consumption Monitoring and Management System" (atlas number: ACR12CDX301) edited by Ankerui Electric Co., Ltd. and Shandong Construction Electrical Technology Information Network, this atlas combined with Acrel-5000 energy consumption The monitoring system complies with the electrical design specifications and meets the requirements for the construction of energy-saving supervision systems for office buildings and public buildings of state agencies, to achieve the scientific and data-based management of green building energy use, and to achieve the goal of saving energy and reducing consumption of green buildings. The Atlas is applicable to the system design, construction, operation and maintenance of energy monitoring and management of office buildings and public buildings of newly-built or rebuilt national offices. If you need atlas, please provide your organization's name, department, address, zip code, contact person, contact telephone number, email address, fax 021-69155331, mail or QQ to Ankeru Xu cream engineer, Ankerui Electric will give you a free gift. .
We have more than 2000 kinds of Clutch Cover and Clutch Disc. Our overseas market includes American ,Europe,Russion, Africa, South american, North american,Middle east,and so on,Our productions have passed certificate ISO9001 / TS16949. We can produce according to OEM,ODM and customer's drawing or sample.
A: We have a wide range of clutch cover items available for American, European, Japanese, and Korean Vehicles, OD range from 150mm - 440mm.
B: More than 8,000 different models, if your inquire by OEM No., or Dakin No., Valeo No., Sachs No., Asco No., Luk No. ect, We can quote you in no time, We guarantee all of clutch disc to be of the highest standard.
C: We can develop according to customers` drawings or samples.
D: Material: 50CrV4 clutch diaphragm spring,High quality non-Asbestos Clutch Facing, High quality toque spring with material 60 Si2Mn, Forging clutch hubs.
E: OEM heat–treatment system for processing.
F: Steady force transmission, Reliable transfer torque.
G: Excellent radiative performance.
H: Long service life, Low wear and tear, Noiseless.
Clutch Cover Clutch Cover for Benz,Clutch Cover for Renault,Clutch Cover for ISUZU,Clutch Cover for Hyundai GREEN POWER INDUSTRY CO., LTD. , http://www.carparts-supplier.com


Research and Application of Cement Enterprise Energy Management System